
Pre-Development at Scale: Modeling Risk in Early-Stage Solar Development
By Alex Oort Alonso, Kyle Baranko, Tony Wagler
Thank you to many for your collaboration throughout this process: Oliver Sandreuter (Lodestar Energy), Charles Jurczynski (DevEngine), Elias Hatem (Madison Energy Infrastructure), Jon Caillouet (New Leaf Energy), Tom Wheeler (Scale Microgrids), Jamal Batar (Harvest Renewables), and Stu Pomeroy (Paces)
Overview
Context:
- Over 70%-90% of renewable energy projects fail due to risks such as interconnection and permitting.
- Forecasting risk and the success of each project is difficult because of high uncertainty early in the development process.
- Reducing uncertainty is time-consuming and challenging because data is fragmented, subjective, and often only attainable through stakeholder engagement.
Key questions:
- Which steps of the solar development process carry the most risk? Which are the most expensive in time and money?
- Can risk be quantified across relationship-driven dimensions like permitting within a local jurisdiction or advancing through an interconnection process?
- Is it possible to create a standardized framework for improving capital efficiency of solar portfolios?
What we did:
- Surveyed leading solar developers in NY about their approaches to assessing project risk within key development milestones. We focused on community solar developers as a larger cohort to survey.
- Received quotes from developers and civil engineers on typical budget and timelines for various reports, studies, and services required to reach Notice To Proceed (NTP).
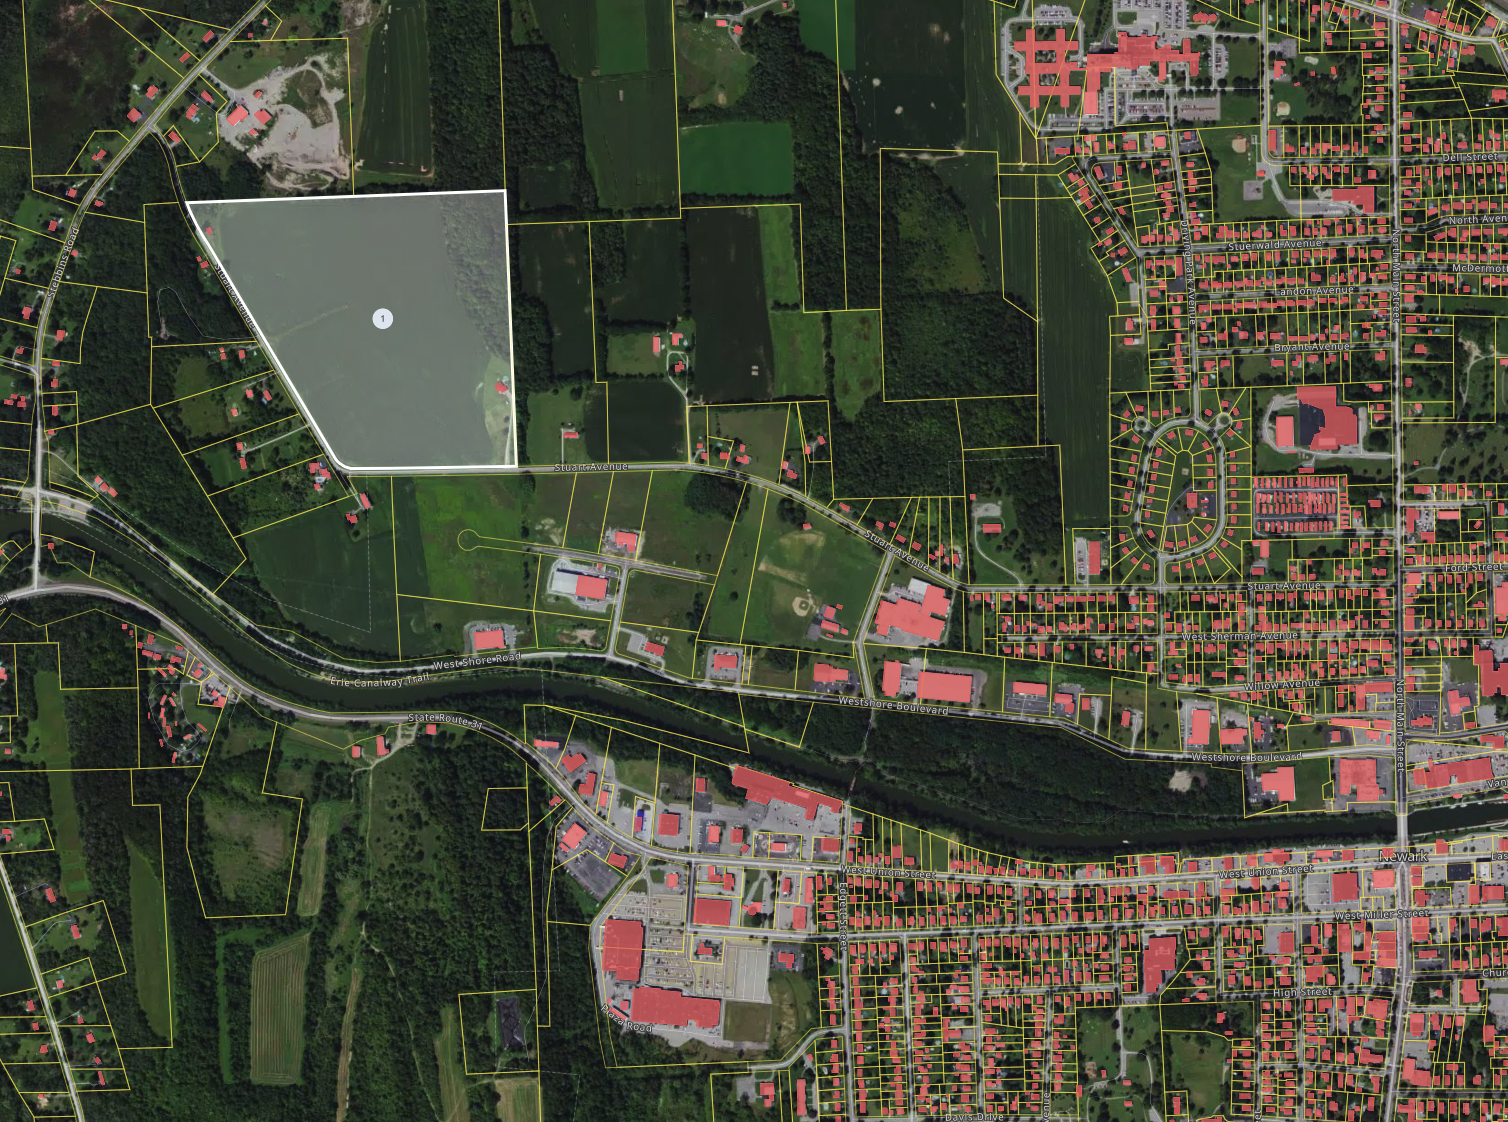
- Researched various AHJs and markets to find a representative AHJ for typical development hurdles in the town of Arcadia New York in NYSEG territory.
- Created a development plan to model best and worst case project scenarios within Arcadia.
- Built a financial model to map development risk of individual projects with a forecasted portfolio Internal Rate of Return (IRR).
Implications:
- It is possible to quantify development risk in a standardized framework based on survey and empirical data from experienced developers.
- Pre-developing sites upfront with desktop data enables developers to categorize sites by risk “archetypes” and identify the most important milestones for each particular project.
- Shifting development strategy to de-risk the most critical factors as early as possible maximizes information gained and reduces the amount of development capital spent on dead projects.
- Given the desktop nature of upfront work required to pre-develop sites, AI Agents are well-positioned to build standardized development plans to process unstructured data and classify projects upfront.
Uncertainty In Early-Stage Development
Early-stage clean energy development is an inherently risky endeavor. Developers must advance projects across multiple dimensions at once—securing site control, evaluating interconnection feasibility, navigating permitting, environmental and design constraints–all while modeling each program’s rules/policies and staying within capital budgeting requirements.
However, obtaining the information needed to make decisions across these dimensions is slow, tedious, and expensive. Public data is fragmented, unreliable, or missing entirely. As a result, the only way to reduce uncertainty is to push the project forward—spending time and capital just to acquire the information required to determine if it is worth continuing. These challenges compound across risk categories, forcing developers to make high-stakes decisions without a full picture of technical and financial viability. For instance, determining whether to fund an interconnection deposit to advance a project requires not just understanding utility timelines and capacity, but also confidence in the site’s path to permitting and eventual value to asset owners.
This uncertainty has real consequences. Based on Paces’ analysis of the US interconnection queue as well as customer surveys, 70%-90% of clean energy projects fail—often after years of development and significant capital outlays—because critical risks aren’t identified early enough. That means most development time and capital are spent on projects that never get built.
Reducing the cost of acquiring reliable information and standardizing how development risk is assessed could dramatically improve productivity, success rates, and investor confidence across the industry. It can also lower the barriers to entry and empower new teams to better compete and bring more projects to NTP with what is typically limited capital and runway for new firms. To address this challenge, Paces set out to create a standardized risk model for early-stage clean energy projects that captures the key milestones and decision points across each risk category.
Modeling Development Risk Over Time
To reach NTP, developers must advance a project across several parallel categories of development, each with its own critical milestones and potential failure points. These categories, often referred to by developers as “swimlanes” or “legs”, are what we define in our model as risk categories. Methodology varies from developer to developer, but they typically include some combination of site control, interconnection, permitting, design, and environmental factors.
Within each category, risk can take many forms. Some are binary and absolute—for example, a local Authority Having Jurisdiction (AHJ) may impose a moratorium on new energy infrastructure, effectively killing the project. Others are more nuanced: an unexpected environmental condition might trigger costly studies or design changes that increase capital expenditures to the point where the project no longer pencils financially. And underlying all risks is the relentless pressure of time as developers are often racing to secure permits before new restrictions take effect, to lock in favorable queue positions before competitors, or to qualify for incentives before program capacity caps are reached or procurement rules change. Timing alone can make or break a project’s economics and viability.
To quantify development risk, Paces created a standardized development plan for a community solar project in the town of Arcadia, New York, and within the NYSEG distribution network. The development plan outlines the specific milestones required to de-risk a project across each category. Each milestone is assigned a best- and worst-case budget, timeline, and a risk reduction score, reflecting the confidence or “information gained” in project viability by completing the milestone. For instance, securing a signed Letter of Intent (LOI) from a landowner or completing a preliminary review meeting with NYSEG’s interconnection team are major de-risking milestones early in development.
The core principle of our model is straightforward: reduce the most risk with the smallest budget as early in the development lifecycle as possible.
The chart below illustrates the results of a Monte Carlo simulation that models how development risk is reduced over time and how budget is spent across many possible project development scenarios. Each translucent line represents a single simulation run, showing one plausible path the project could follow in terms of risk reduction (left axis, red) and cumulative development capital spent (right axis, blue). The bold lines highlight one strategically sequenced, stepwise development path.
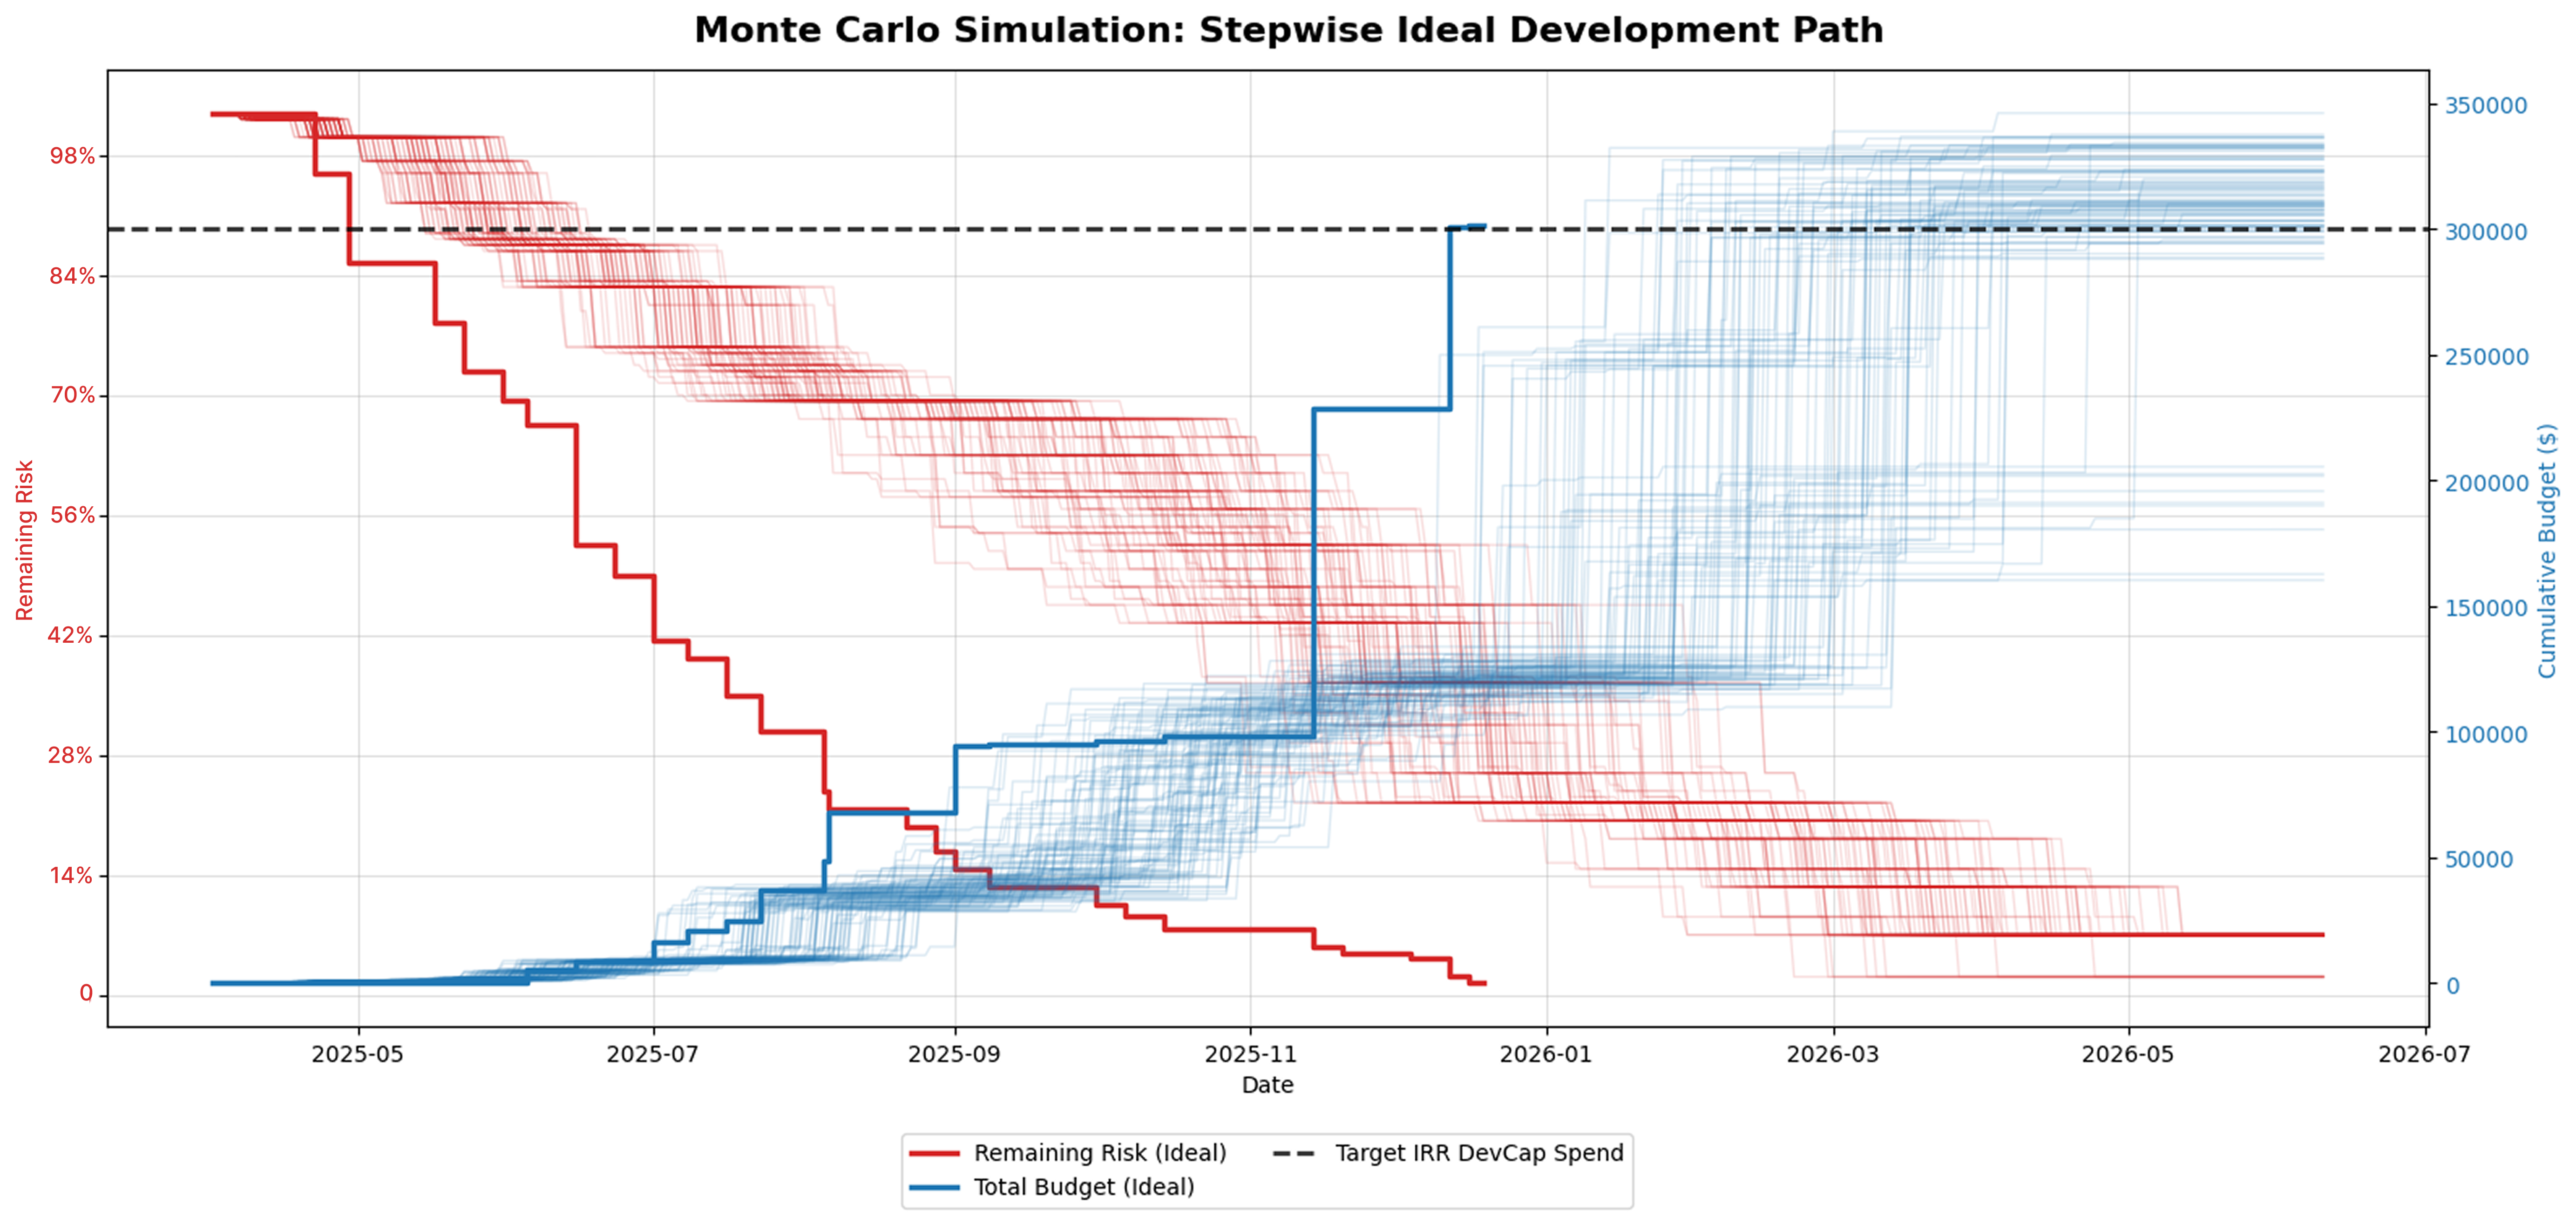
The Monte Carlo approach captures the inherent randomness and uncertainty in early-stage project development. Rather than relying on a single timeline or budget estimate, this simulation samples from defined ranges of task durations and costs (“Min/Max Time” and “Low/High Budget”) and incorporates interdependencies between tasks and risk categories. This produces a more realistic view of:
- When each risk milestone might occur,
- How much it might cost to reach that point, and
- The overall development timeline and capital required to reach Notice to Proceed (NTP).
The bold ideal path illustrates how targeting high-risk, low-cost tasks early can accelerate confidence and reduce downstream delays. By concentrating spend on the milestones that remove the most uncertainty (which vary by site), projects can progress more efficiently toward NTP. The horizontal dotted line represents the developer’s capital allocation threshold, highlighting which simulated outcomes exceed budget expectations. Together, the chart provides a clear view into a project’s risk envelope, supporting more informed internal planning, partner coordination, and investor confidence.
Categories of Risk
Paces identified five primary categories of development risk to include in its standardized development plan:
- Site Control
- Interconnection
- Permitting
- Environmental
- Design
These categories were chosen not only for their central importance to project viability, but also because they are the most automatable when leveraging existing datasets. While additional factors such as off-take risk, capital availability or supply chain uncertainty also influence overall project success, they were excluded from this initial framework to maintain focus and clarity. The selected five categories are deeply interconnected, but the model isolates each independently to enable precise scoring, while still capturing their cumulative impact on project outcomes.
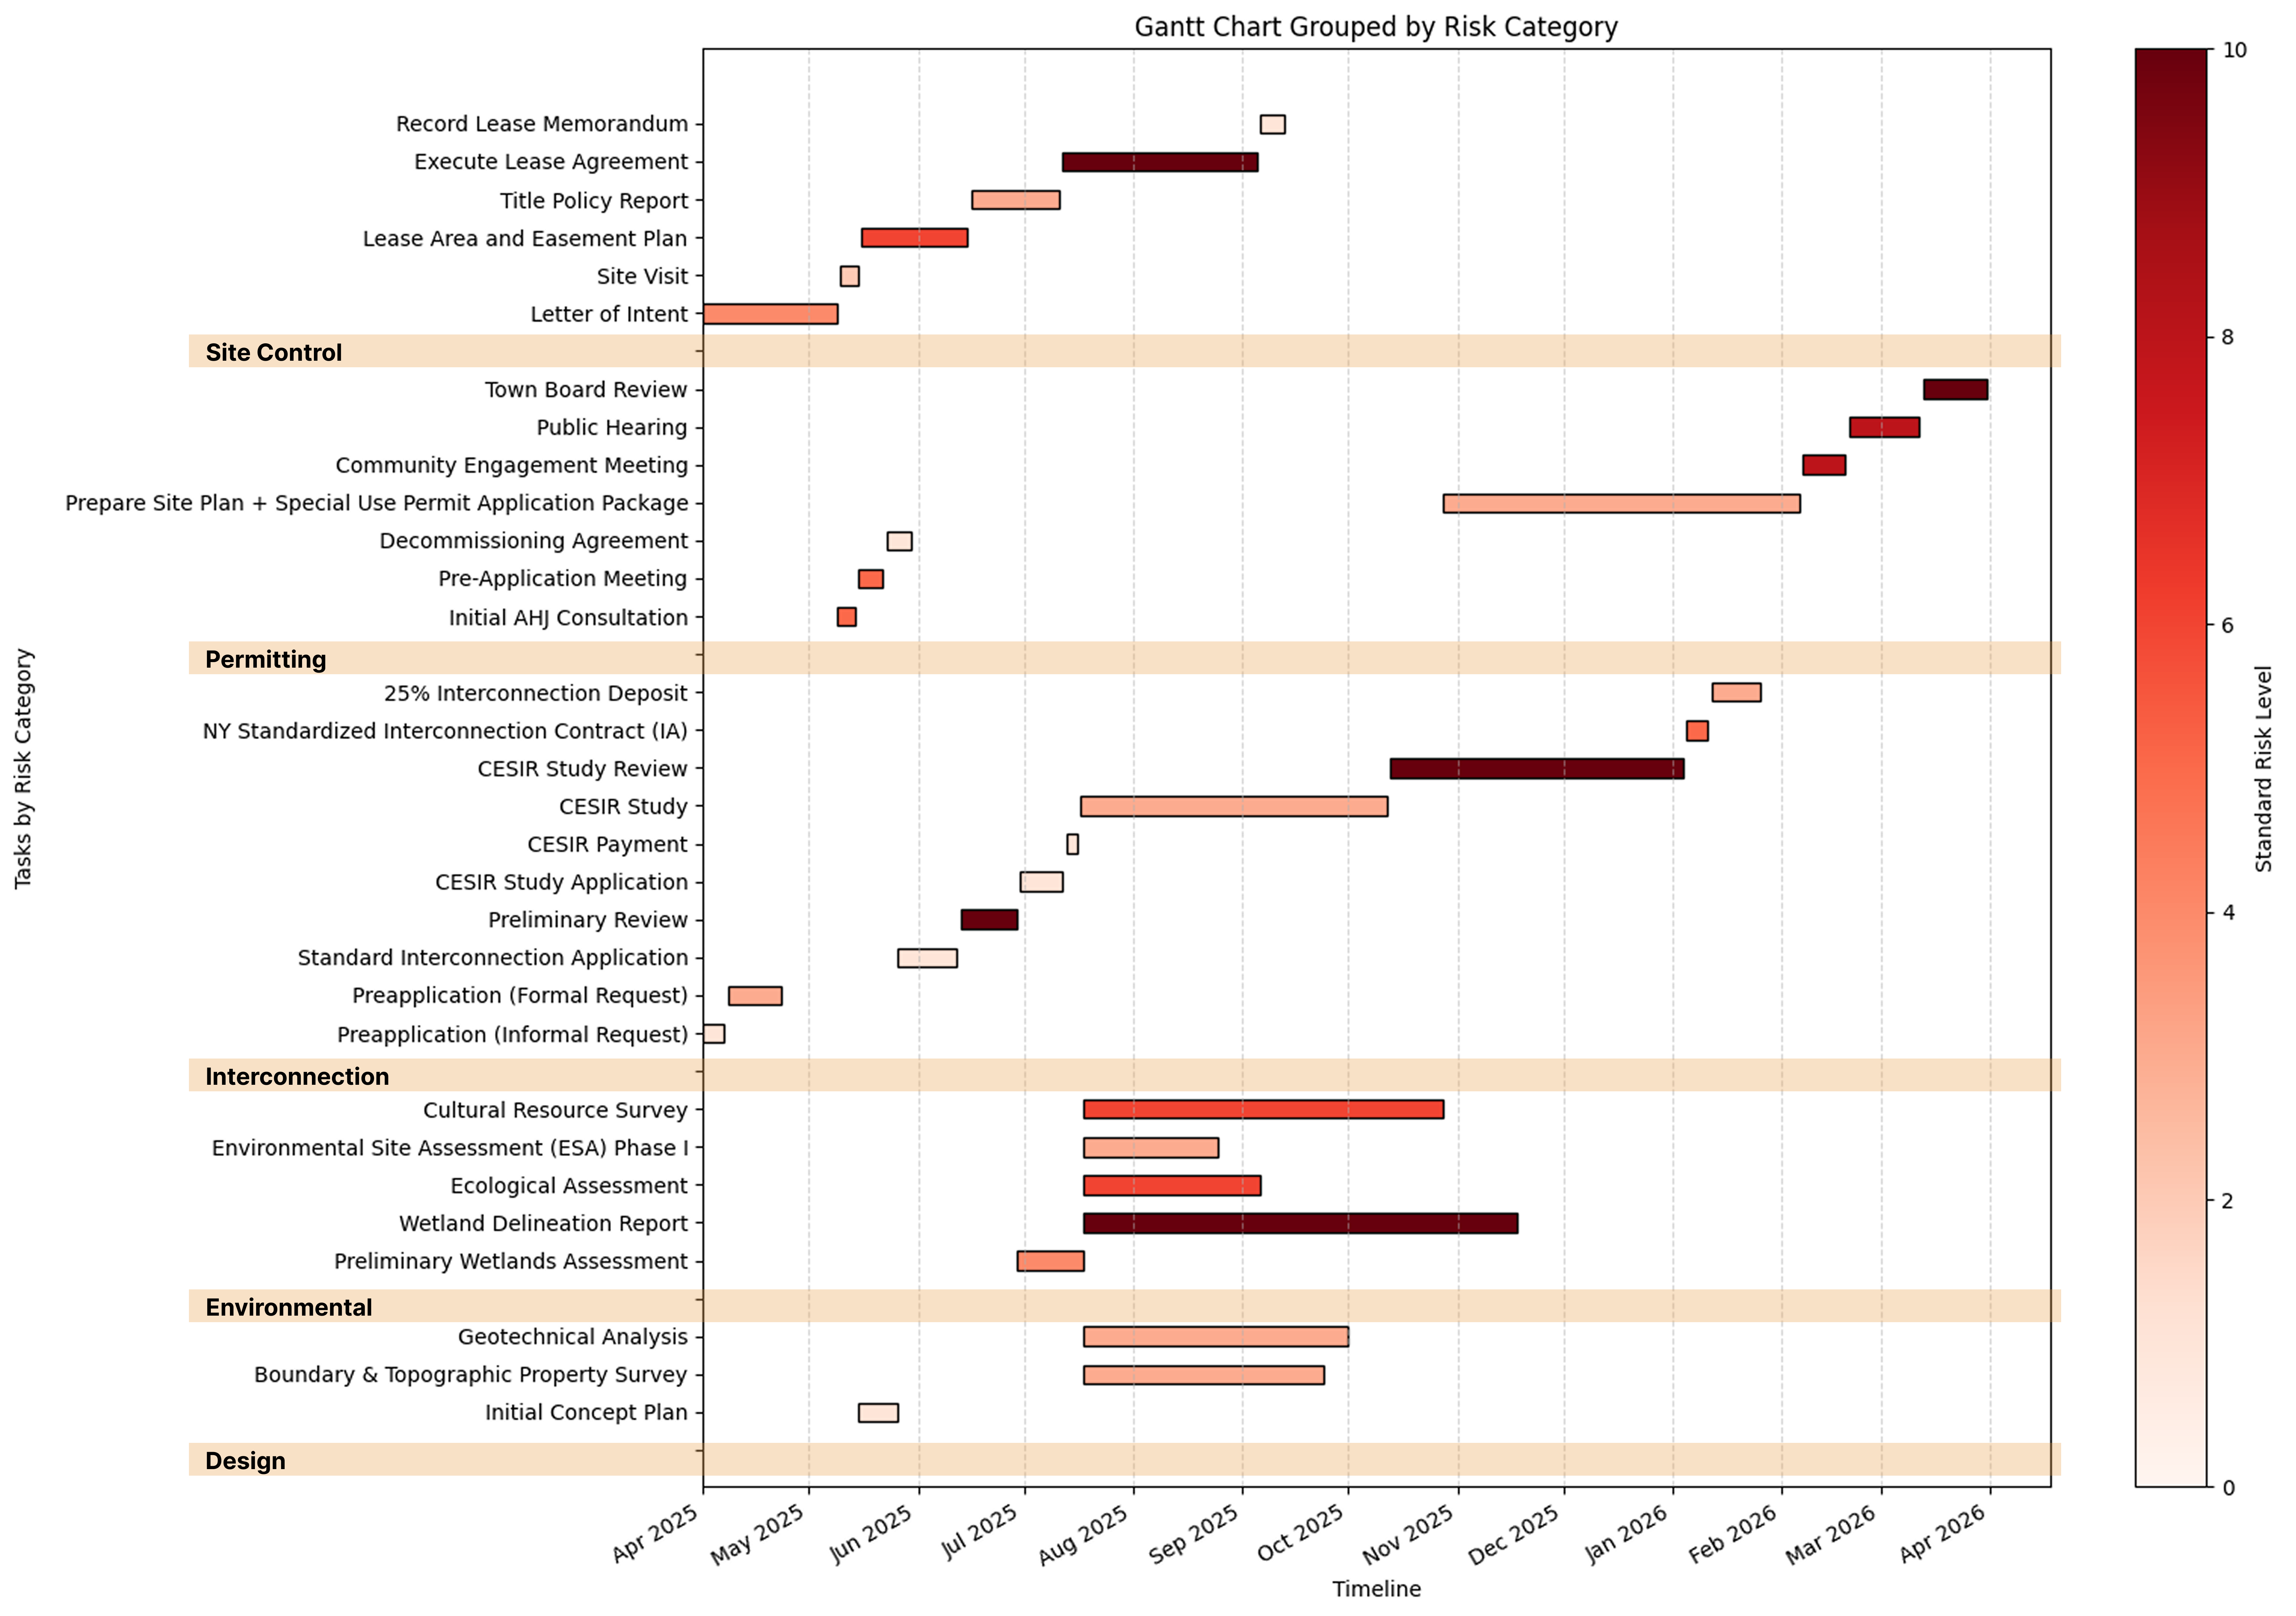
To illustrate how these categories are translated into actionable development strategy, the following Gantt chart maps out the full set of tasks associated with each risk category. This visual acts as a bridge between the conceptual framework and the simulation model introduced earlier (Figure 1), serving both as a development timeline and as a foundation for risk-weighted analysis.
This Gantt chart visualizes the full development schedule for the proposed project, organized by risk category. Each horizontal bar represents an individual task, plotted from its estimated start to end date. Tasks are grouped under section headers by category (e.g., Permitting, Interconnection, Design), and the color of each bar reflects its associated risk level (darker reds indicate higher perceived development risk).
The chart reflects both typical task dependencies (e.g., design cannot start before site control is secured) and category-specific sequencing (e.g., permitting steps follow a logical order). It enables stakeholders to assess the overall project flow quickly, identify critical tasks, and understand how risk is distributed across the timeline.
Site Control
The first hurdle is landowner willingness. Developers must identify and engage landowners who are open to negotiating a lease or purchase at a price that aligns with the project’s economics. This process alone can take months, and there’s no guarantee of success. Even when landowners are interested, developers often need to secure the opportunity by entering into an option agreement—paying for the exclusive right, over a defined period, to lease or purchase the land in the future.
These option payments are typically non-refundable and made before the project is proven viable, making them an early financial risk in the development process. For sites suitable for community solar in the town of Arcadia, in NYSEG territory, these payments can range from $10,000 to upwards of $25,000 per year, depending on land value and option term. Meanwhile, developers are competing with real estate investors, industrial users, or housing developers who can often offer higher prices and move faster.
Further complicating matters, title issues can emerge late in the process. Unrecorded easements, unresolved ownership disputes, or restrictive covenants can derail a project even after initial agreements are in place. All of these factors make site control a high-risk category early in development, where progress is essential but uncertainty remains high.
Interconnection
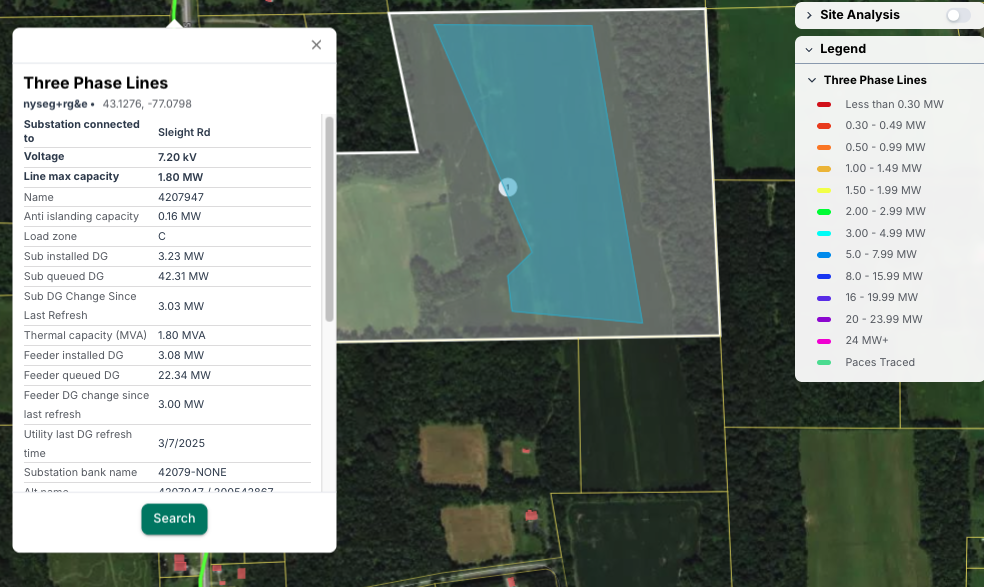
Interconnection in New York follows a standardized regulatory process, but it remains one of early-stage development's most consequential risk categories. The process often begins by reviewing publicly available hosting capacity maps and interconnection queue data to identify substations and feeders with potential headroom. If the data suggests a viable opportunity, developers may proceed with an optional preapplication request, which provides more detailed local electric system information for a $750 non-refundable fee. If a formal application is submitted within 15 business days, the fee is credited toward the application. Once the Standard Interconnection Application is submitted (along with proof of landowner consent) the utility conducts a Preliminary Review and, if applicable, issues a cost estimate for the next phase, the CESIR.
The Coordinated Electric System Interconnection Review (CESIR) is the highest-risk point in the interconnection process. To proceed, developers must submit a formal authorization and pay a non-refundable fee, often between $15,000 and $25,000. The utility then conducts a detailed engineering study to determine what system modifications are required to accommodate the project. The study may identify the need for substantial distribution upgrades, such as substation expansions, feeder replacements, or protection system changes.
If the resulting upgrade costs are excessively high, they can break the project’s financial model entirely or shift project timelines beyond what is commercially viable. Developers must then choose whether to abandon the project and sacrifice all development costs to date or proceed to execution of the Standardized Interconnection Contract, which locks in both technical requirements and cost responsibilities. If executed, a 25% deposit on total upgrade costs is then due within 90 business days, with the remaining balance then payable within the subsequent 120 business days.
Because upgrade needs are determined by local hosting capacity, load profiles, existing queue positions, and other factors outside the developer’s control, interconnection introduces uncertainty at a critical stage. High upgrade costs or delays can halt an otherwise viable project.
Compared to other community solar states, New York is more structured in its interconnection process and transparent with sufficient regularly updated and publicly available information regarding queue position and who specifically (a person or entity) owns that position. While transparency does not reduce the risk of a high-cost interconnection or challenging timeline, it at least allows market participants to get up to speed quickly on how to develop and invest in the state’s program and get an early indication on where projects can be successful (quality data allows for risks to be better managed/analyzed and reduced throughout the process).
Permitting
Permitting is one of the most consequential and binary steps in the community solar development process. In upstate New York, securing local approval is required and not guaranteed (largely discretionary in nature), even for well-sited projects that meet initial guidelines. Developers must navigate a multi-stage review that typically includes zoning confirmation (type/setbacks), site plan approval, a special use permit, and public hearings. While the process is structured, outcomes can hinge on town-specific ordinances, board dynamics, and public sentiment. A denial at any point, particularly during the final vote, halts the project with no viable path forward. Developers thrive when they spend more time meeting with local stakeholders to explain the many benefits of solar to the community including a second income for the private landowner, distribution grid upgrades and economic growth with jobs and lower utility bills.
The process begins with an initial consultation with an Authority Having Jurisdiction (AHJ) representative, typically the town planner or code enforcement officer. This early engagement confirms whether the site is zoned for solar and clarifies the town’s permitting expectations. Many towns require or strongly encourage a formal pre-application meeting with the code officer, town engineer, and planning board representatives to review the concept and identify red flags. This step helps establish procedural alignment and often results in a checklist of studies and documentation needed for the full application.
Next, developers must prepare a comprehensive application package, which includes technical plans, environmental documentation, visual simulations, and a detailed decommissioning plan backed by financial surety—typically 150% of the estimated removal cost. The Planning Board reviews applications, and most towns require a community engagement meeting before the formal public hearing to facilitate dialogue with residents and stakeholders.
The public hearing itself is a legal requirement and often a pivotal moment in the permitting process. Despite full compliance with local law and State Environmental Quality Review Act (SEQR), projects can still face opposition over aesthetics, land use, or perceived community impact. Ultimately, the town board or designated reviewing body renders a decision, often via resolution, based on input from the planning board and the public.
Permitting risk is binary: a single vote can stop a project, regardless of technical merit or investment to date. Unlike interconnection or environmental studies, which can be iterated or mitigated, there is no remediation path for a denied special use permit. For that reason, permitting remains one of the most uncertain but decisive gates in the community solar development process.
Environmental
Environmental risk is one of the most difficult, expensive, and ultimately unpredictable aspects of early-stage development. While some concerns can be flagged early using public datasets and mapping tools, many critical issues require on-site investigations, coordination with state and federal agencies, and engagement with specialized consultants—often surfacing late and threatening to fundamentally alter project feasibility.
Environmental diligence includes a mix of standard industry assessments and reviews required by state and federal agencies. Developers typically begin with desktop mapping to identify obvious constraints, like wetlands, floodplains, or conservation areas, but public data is often incomplete or outdated. To validate findings and meet permitting requirements, developers commission field studies to confirm the presence of regulated features and evaluate potential impacts to sensitive species or habitats, which may impose seasonal restrictions or prohibit development altogether. While some steps are precautionary, others, like wetland delineations, are essential for agency review and project permitting.
Additional assessments may be required depending on site history and location. A Phase I Environmental Site Assessment (ESA) is standard practice before financing and reviews potential contamination risks, including underground tanks or industrial pollutants. In areas with cultural or historical significance, Cultural Resource Surveys evaluate potential impacts to archaeological sites or protected structures. Agencies such as the New York State Historic Preservation Office (SHPO) play a critical role in these reviews. Together, these studies represent a major time and cost investment, but skipping them can expose projects to late-stage surprises that force redesigns, trigger agency delays, or halt development entirely.
Environmental constraints are among the most difficult and costly to resolve, often surfacing late in development and leaving little room for mitigation. Sensitive habitats can trigger seasonal restrictions or halt permitting altogether, while wetlands, floodplains, or contamination risks may require expensive redesigns, mitigation plans, or even site abandonment. These challenges increase capital expenditures, reduce project returns, and can delay timelines due to lengthy agency reviews.
A site that initially appears viable may become technically or financially infeasible once full environmental assessments are completed, meaning developers can invest significant time and capital before discovering a project cannot move forward.
Site Design
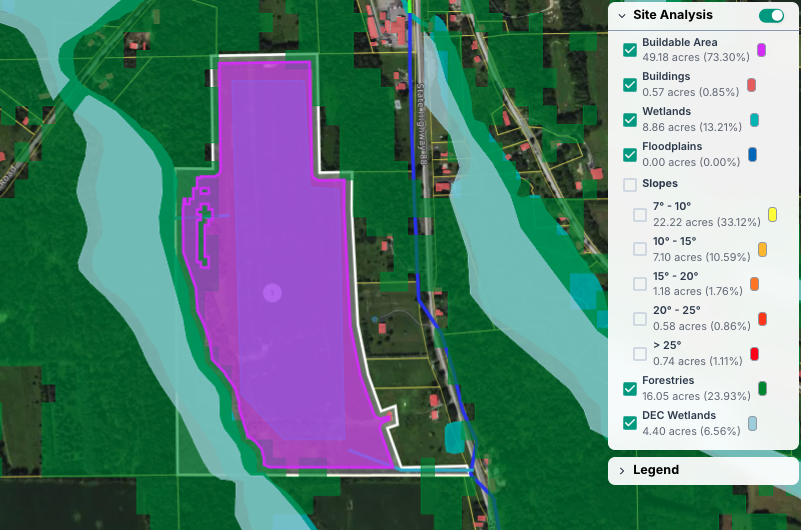
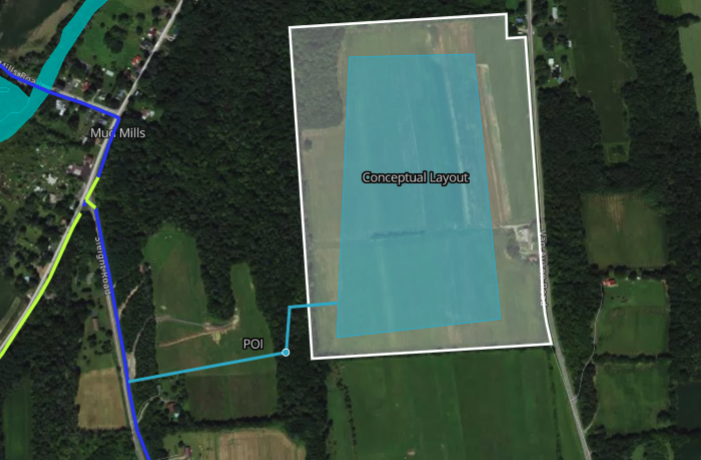
Site design plays a critical role in determining whether a project is physically buildable and whether it can be constructed within budget. Early layout planning typically begins with a high-level concept plan, using desktop data to identify major constraints like slopes, buffers, or wetlands. From there, developers must evaluate whether the site can accommodate the necessary infrastructure to connect to the grid, including the feasibility and cost of building a tie line to the point of interconnection. In many cases, access to the substation may require long conductor runs, offsite easements, or complicated routing that significantly impacts capital costs or requires buy-in from neighboring landowners.
More detailed studies are needed to validate the site’s buildability as the design is refined. A full boundary and topographic survey confirms parcel dimensions and elevation changes, which influence equipment layout and grading needs. A storm water prevention plan may be required in certain circumstances. Access roads must be planned to ensure construction crews, and equipment can physically reach the site and a geotechnical analysis is required to test soil conditions and determine the type of foundations or racking needed to support the array. These studies are expensive but essential. If the subsurface can’t support standard equipment, foundation costs may spike or the site may prove infeasible altogether. In this way, design is both a cost driver and a viability gate, often revealing challenges that can't be seen from satellite imagery or landowner conversations alone. Without adequate designs up-front, projects tend to shrink in size and energy/production yield once all factors are considered.
Furthermore, design decisions impact procurement and construction plans, such as the availability of long-lead equipment and construction crews. If not managed early, those plans can materially impact project timelines, bumping a project from one calendar year into another, or from one incentive program tranche down into the next. Delays like those create additional time pressure, strains on project finance and tax equity expectations, and add dependent risks downstream of design.
Using Project Archetypes to Calibrate Risk Profiles
Not all projects face the same risk distribution across the categories outlined above. To more accurately model development uncertainty, Paces introduces the concept of project archetypes: distinct risk profiles that shape how individual steps should be weighted across categories. By tailoring risk weights to the project’s archetype, developers can prioritize the most consequential milestones early and reduce wasted effort on low-probability paths to viability.
For example, in a permitting-heavy jurisdiction with public opposition or a particular site with many abutting properties, permitting steps should carry more risk weight. By contrast, in a capacity-constrained grid area, early utility engagement may yield the greatest clarity. Understanding which risk category is most likely to kill a specific type of project enables developers to construct an intentional plan to either de-risk quickly or fail fast.
In the town of Arcadia, New York, Paces applied this framework to a set of potential community solar sites. Sites with obvious non-starters, such as infeasible solar layouts, no viable path to a substation, or feeders with zero capacity and no upgrade options, were immediately excluded from the sample. The remaining sites were grouped by archetype based on the dominant source of uncertainty. From there, each archetype received a bespoke de-risking strategy tailored to its most pressing threats.
While some archetypes are inherently more favorable or commonly experienced than others, developers often encounter sites that straddle multiple archetypes, compounding the difficulty and increasing capital risk. Archetypes assume, for simplicity, that a willing landowner is already secured. From there, the distribution of risk across the project’s development categories depends heavily on the specific characteristics of the site and grid context.
Paces identified four recurring archetypes in the Arcadia analysis:
- Archetype I – Environmental Constraints
Sites located near known environmental hazards or sensitive areas should allocate an early budget to field studies that directly assess the specific constraint like wetlands, floodplains, or protected habitats to determine whether it poses a fatal flaw.
Example de-risking strategy: Commission a full wetland delineation and report early, before committing CESIR funds. - Archetype II – Permitting Complexity (Sentiment)
In jurisdictions where public or political sentiment may slow or stop a project, community engagement becomes paramount. Developers should invest in local relationship-building early in the process to identify potential friction points and build goodwill.
Example de-risking strategy: Meet with town officials, fire departments, and nearby residents to assess community sentiment before commissioning expensive studies. - Archetype III – Design Feasibility
Even if a nearby substation has available capacity, a project may still be non-viable if the interconnection point is too far from the proposed array. Developers must assess the cost and constructability of routing key infrastructure, like tie lines and access roads, particularly where easements or coordination with neighboring landowners is required.
Example de-risking strategy: Advance site design early and initiate easement discussions with adjacent property owners. - Archetype IV – Capacity Viability
In regions where substations appear to have limited remaining headroom but show large volumes of queued MW, developers must dig deeper. Queue data alone can be misleading, as many queued projects may never proceed.
Example de-risking strategy: Get to a preliminary review meeting with the utility as fast as possible to assess the likelihood that queued capacity is firm before committing to costly interconnection studies or land expenses.
By identifying a project’s archetype early, developers can design more efficient development strategies and avoid overcommitting time or capital to high-risk paths. The goal is to get to “no” as efficiently as possible when the project doesn’t have a viable path forward.
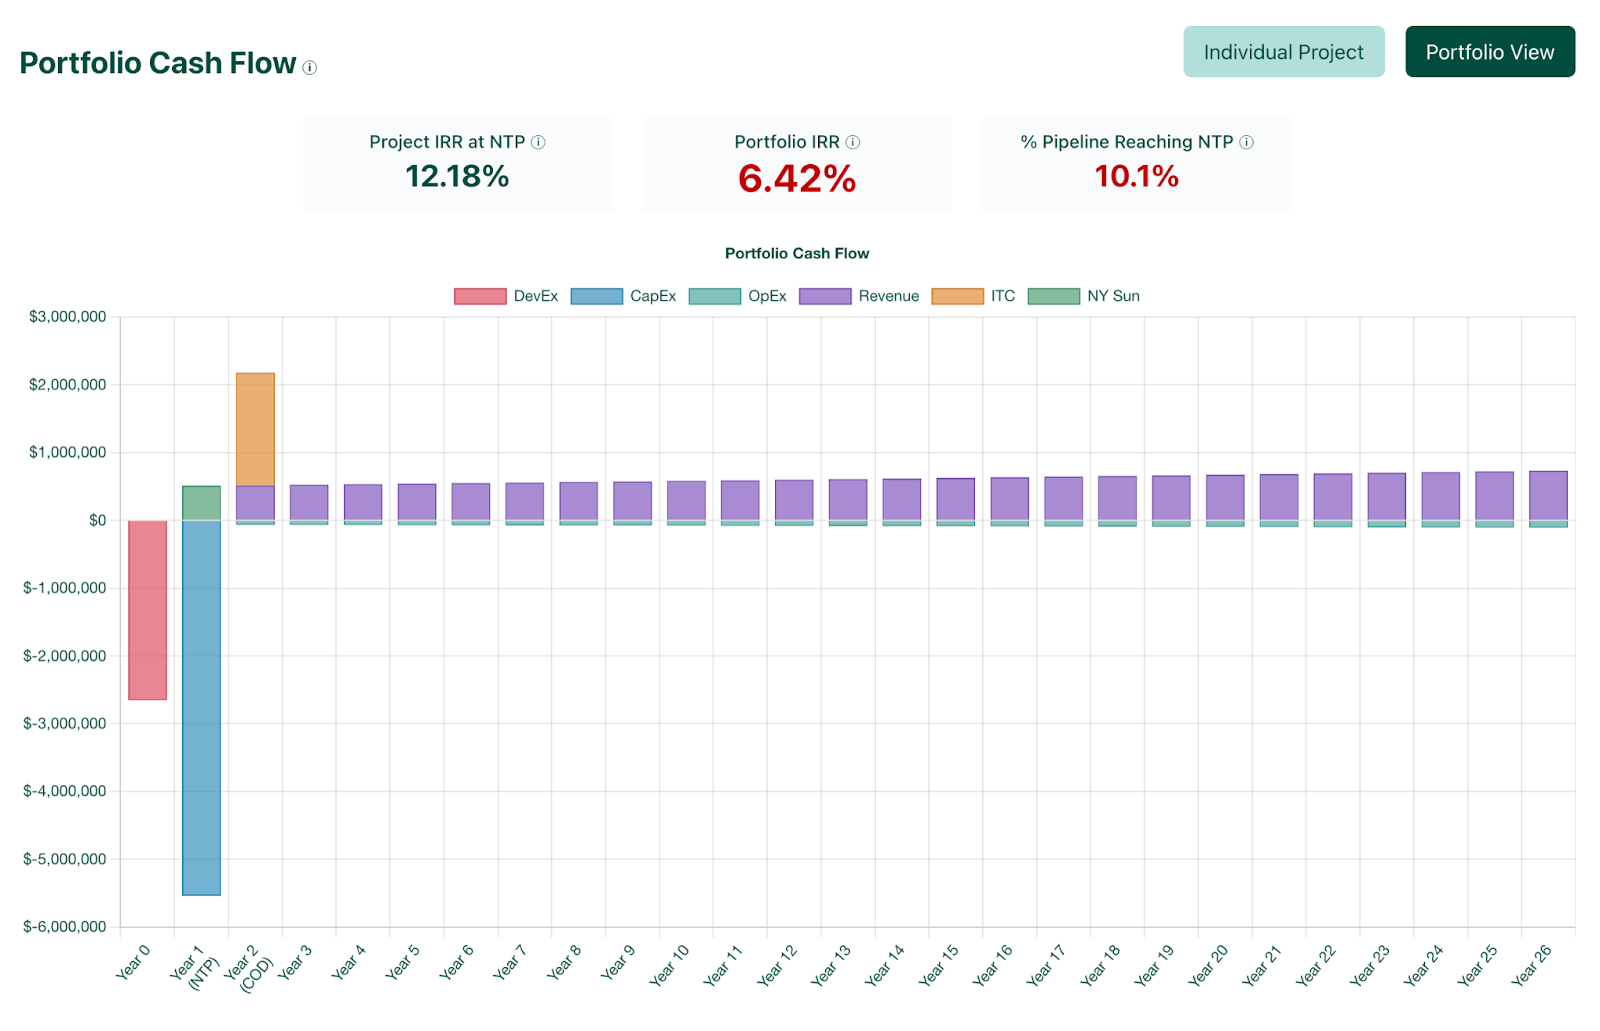
Financial Model
As projects progress through development, developers must continuously evaluate two parallel risks: first, the possibility that a project will be prevented from being built outright, and second, that rising costs could push an otherwise viable project below its target internal rate of return (IRR). To manage these uncertainties, most developers maintain a lightweight financial model for each project in their pipeline as well as their total pipeline, constantly updating assumptions as new information becomes available.
To capture both failure risk and cost escalation in a single metric, developers can use expected IRR. This approach blends projected cash flows with the probability of success at each stage of development. For example, in a ten-project pipeline, the expected IRR reflects the average return across the portfolio, accounting for both successful projects and those that fail and absorb sunk costs. In this way, the expected IRR offers a more realistic view of financial performance than a traditional deterministic discounted cash flow (DCF) model, which assumes all projects reach completion.
Model Specifics
To concretely illustrate the impact of early stage development risk on expected financial returns, Paces built a simplified financial model that captures both binary project failure and how escalating development expenses (DevEx) and capital expenses (CapEx) kill project viability, enabling us to compute an expected portfolio IRR. In our example, we modeled a 10-project portfolio of 3MWs each in New York State using the empirical averages of budget and risk for our inputs.
For each risk category, the model assigns:
- A Financial Risk Scenario: Adjusting DevEx and CapEx costs based on the best and worst case scenarios. Higher risk means each milestone is more likely to end up on the higher end of the budget range.
- An Approval Risk Rating (1–15): Indicating the likelihood of the project advancing to subsequent milestones. Higher risk means the project is less likely to advance to the next milestone, accounting for projects that fail outright during development.
We constructed a discounted cash flow (DCF) model for a 25-year portfolio of solar projects, which varies based on the blend of financial risk and approval risk as inputs. Higher financial risk negatively impacts portfolio IRR by increasing total DevEx and CapEx per project, whereas higher approval risk results in higher sunk development costs by decreasing the percentage of projects receiving approval to proceed and reaching NTP.
This approach produces an average IRR for the project portfolio, providing developers with a risk-adjusted performance metric that reflects both cost uncertainties and the probabilities of project approval. The figures below clearly illustrate how high financial risk and high approval risk negatively impact portfolio IRR in different ways.
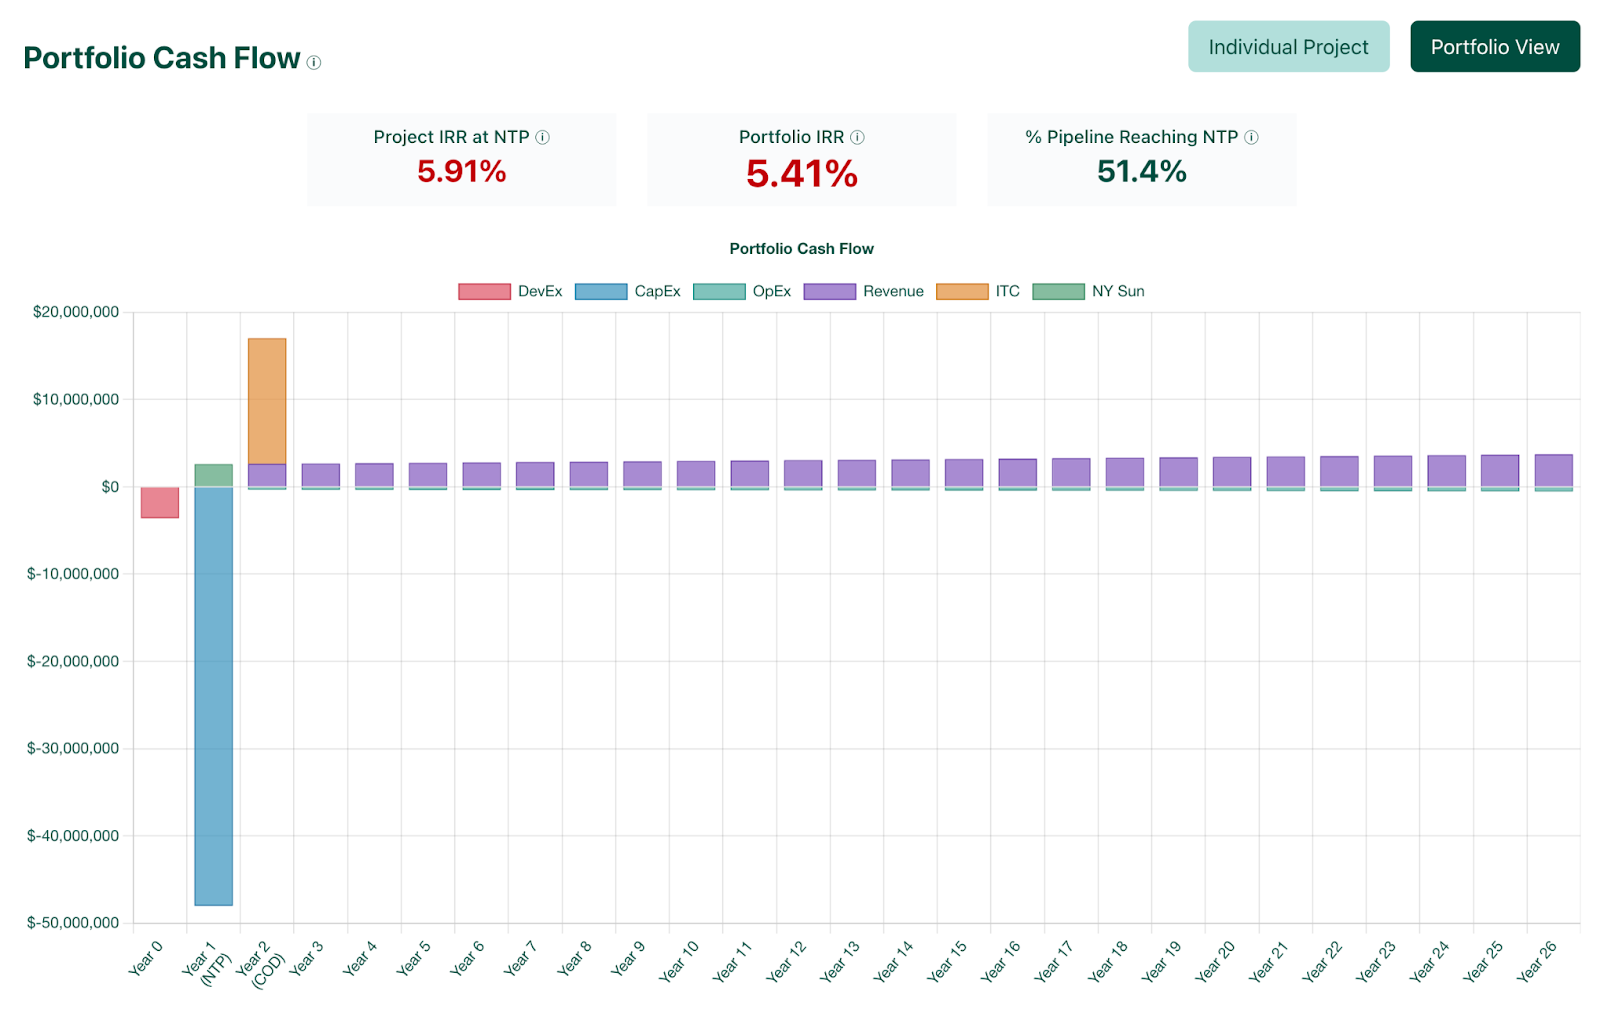
Across the five different risk categories, we also observe distinct patterns in how the internal rate of return (IRR) responds to both approval risk and financial risk. Permitting, for example, involves minimal financial uncertainty because costs associated with permitting are relatively stable, resulting in little difference between the best- and worst-case financial scenarios. As a result, it behaves almost like a one-dimensional risk: as approval risk increases, fewer projects advance, and the sunk costs associated with those failed projects reduce the overall portfolio IRR.
Other risk categories, however, are more two-dimensional. Design, for example, can affect both the likelihood of a project moving forward and the potential for significant cost overruns. These two dimensions interact, compounding uncertainty and creating a broader set of possible scenarios and outcomes for IRR.
Understanding these archetype-driven differences enables developers to better prioritize projects and allocate resources efficiently, focusing attention on managing the risks most capable of drastically affecting financial outcomes.
Conclusion: The Pathway to Automation
Building standardized development plans and classifying risk profiles at scale based on publicly available datasets enables developers to assess site viability and forecast portfolio returns before ever setting foot on the ground. With high-quality geospatial data, a basic site design, and knowledge of the permitting and interconnection landscape, much of the “pre-development” process can be front-loaded, identifying and reducing the majority of risk with a fraction of the time and effort typically required.
Today, creating and maintaining dynamic development plans is difficult, especially in the early stages of a project. The process is tedious, time-consuming, and highly manual, requiring developers to organize messy datasets, track evolving stakeholder inputs, and continually update timelines and risk assumptions.
The challenge isn’t just scale but the variability within that scale. Developers are often managing dozens of early-stage opportunities across different jurisdictions, utility territories, and regulatory frameworks. Each site presents its own data gaps, permitting nuances, and interconnection hurdles. Just building an initial picture of risk, let alone mapping key milestones and a viable strategy, requires an enormous investment of time. With limited resources, the sheer effort required to stay organized across a broad pipeline leads to missed signals, outdated assumptions, and overlooked opportunities.
Recent advances in AI offer a way to dramatically reduce this operational burden. AI agents, autonomous systems powered by large language models (LLMs), can reason through unstructured information, make decisions, and update their understanding over time. Unlike traditional scripts or static workflows, agents can interpret ambiguity, extract structure from disorganized inputs, and adapt to changing conditions. In the context of development, this means transforming emails, PDFs, regulatory filings, and other fragmented sources into structured, actionable data.
Deployed effectively, intelligent agents can monitor correspondence with permitting authorities, flag when key milestones are reached, and automatically update timelines, budgets, and risk scores as new information becomes available. What was once a tedious and fragmented process becomes a continuous, intelligent system, offering developers the benefits of discipline and rigor without the overhead. The result: lower soft costs, clearer visibility into risk, and more deliberate portfolio management across the entire development pipeline.
Ultimately, early-stage development becomes an optimization problem for the AI agent: reduce the greatest amount of risk with the least amount of capital, as quickly as possible. Automation adds value by enabling a fundamentally new approach to early-stage development—one that is:
- Machine-Driven – Systems should be designed to eliminate the need for manual data entry, allowing updates to flow naturally from project communication, design changes, and stakeholder responses.
- Standardized – The current lack of consistent formats across counterparties makes it difficult to evaluate and compare risks. A standardized model creates a common language for development progress and risk evaluation.
- Generalizable – The framework must adapt across regions, permitting regimes, and utility programs, especially when one or more transaction parties are new to a market or program.
- Empirical – While development has long been seen as more art than science, the industry suffers from a lack of reliable data on timelines, budgets, and success rates. Capturing and analyzing these metrics systematically enables smarter decisions over time.
These principles are central to Paces’ Accelerated Development Framework which offers a structured approach to managing early-stage development risk, shifting it from a reactive, intuition-based process to one grounded in data and repeatable methods. This framework supports better decision-making across the development pipeline by enabling developers to identify, monitor, and reduce risk and uncertainty more efficiently. Paces does this all on one intuitive screen with layers and filters on digitized data sources such as hosting capacity maps, special use permits, town meeting minutes and environmental conditions (i.e. wetlands). This allows human ingenuity and AI to explore development opportunities together, which greatly enhances productivity, insights and outcomes. In a resource-constrained and increasingly competitive environment, tools that streamline risk assessment and help allocate time and capital more effectively are not just useful, they’re essential to building successful, scalable portfolios.
Appendix: Notes on Budgets, Timelines, and Assumptions
- Budget estimates and timelines are based on research with community solar developers operating in New York, as well as from civil and electrical engineering firms. Actual figures may vary by region, firm, and project complexity.
- Some development steps were approximated or grouped for simplicity and modeling purposes.
- Budget and timing assumptions often reflect scenarios where external contractors, such as civil or electrical engineering firms and outside legal counsel are used. Developers with in-house capabilities may be able to reduce costs and timelines significantly.
- Interconnection is consistently cited as the highest-impact category to de-risk early, particularly in New York and other capacity-constrained markets.
- Timelines and budgets for interconnection can vary widely based on a developer’s strategy, including their willingness to engage in cost-sharing for upgrades or negotiate joint infrastructure solutions.
- While the permitting model references one township for specificity, the general process and structure are broadly applicable and can be adapted to other jurisdictions with similar frameworks.
- The financial model is designed to provide directional insights rather than a precise financial forecast. Some assumptions of the model include:
- No modeled reliance on debt or external financing.
- Specific financial parameters
- A $140/MWh electricity rate (derived from previous community solar models).
- A 2% standard escalation rate.
- A base $0.17/W NY Sun incentive for upstate New York.
- All projects in the portfolio are assumed to be one of the same size and have the same financial parameters.
- To enhance clarity, the model is designed with simplicity in mind, which comes at the cost of certain limitations:
- Risk Interdependencies:
- The model assumes that risks in the development process are independent.
- In reality, these risks can be highly interrelated and may compound one another.
- Approval Risk Conversion:
- The conversion formula used to translate approval risk into a probability is not based on empirical data but on expert feedback.
- Developers are encouraged to adjust the model based on their historical experience.
- Simplified Cost Timing:
- The model assumes that all development costs occur simultaneously.
- This approach does not account for differences in cost impact across stages:
- Early-stage failures (e.g., issues with site control) typically incur lower sunk costs.
- Later-stage failures (e.g., after receiving CESIR results) tend to be more costly.
- Risk Interdependencies: